


Over the years, and particularly at the time of this writing (September 2023), the topic of HVAC profit margins and HVAC profit margins can make or break a contracting business. Yet year after year, we hear the same story from customers and contractors in our network: the numbers just don't add up, and no one can pinpoint why.
Sound familiar? You're not alone if you're:
Working nonstop all year, only to land on a 2 or 3 percent net profit at the finish line, or worse, a loss.
Flying blind on gross profit margins, with no clear read on how you're pacing toward your goals.
Ready to take control of your margins, but stuck without a process or the right tools to get there.
In this post, we break down a clear, three-tiered process for tackling these exact challenges in an HVAC business, built on insights from a recent interview with ServiceTitan's Chris Hunter. It's the same framework the most successful HVAC businesses use to stay profitable, no guesswork required.
Before we get into the tiered process, however, let's answer some common questions about HVAC profit margins.
Want to see how ServiceTitan can help you protect your margins and grow the bottom line for your HVAC business? Schedule a call today.
How Much Profit Should an HVAC Business Make?
HVAC contractors deserve and should be shooting for 20 percent net profit in their business. But anywhere between 10 percent and 20 percent is considered a healthy, reasonable net profit margin.
Yet the average HVAC business often operates at profit margins below 10 percent, and in many cases, net profit margins are as low as 2 to 3 percent.
This is a vulnerable place to be, considering all of the costs and risks associated with running an HVAC company. Contractors operating at this level are not being compensated adequately for their time, effort, and investment.
A 20 percent margin isn't padding; it's protection. It covers your true costs (cost of goods sold, overhead, insurance, taxes, etc.) and leaves enough left over to absorb a slow season, a costly repair, or an employee walking out the door. Fall short, and there's no cushion left when things go wrong.
Wherever your net profit margin stands today, the processes outlined below are a crucial step toward closing that gap.
The #1 newsletter for the trades.
What’s an Acceptable Gross Profit Margin for an HVAC Business?
According to our industry expert Bill Powers, HVAC businesses should be shooting for an average gross profit margin of 50–55 percent across their services. Doing so generally allows them to hit a desirable 17–20 percent net profit margin.
Importantly, gross profit margins are how businesses should measure performance in each department (HVAC installation, service and repair, maintenance, new construction, etc.), whereas net profit margins are how they should look at performance across their entire business.
What Factors Impact HVAC Profit Margins?
Dozens of variables can influence HVAC profit margins, but most of them ultimately trace back to these five core business drivers:
Labor efficiency
Overhead control
Pricing and gross margin management
Recurring maintenance
Customer acquisition efficiency
Bonus: Seasonality can also significantly impact revenue, technician utilization, and cash flow throughout the year.
Understanding how each of these factors affects profitability is the first step toward identifying margin leaks and foolproofing your HVAC business.
Factor #1: Labor efficiency
Labor is the largest controllable expense for most HVAC businesses, which makes labor efficiency one of the biggest drivers of higher margins.
The table below illustrates how different labor efficiency levels typically affect an HVAC company's net profit margin and why.
Labor efficiency level | Typical technician productivity | Approx. gross profit margin | Approx. net profit margin | Typical characteristics |
Poor | < 55 percent billable utilization | 20–30 percent | -5 percent to 3 percent | High callbacks, weak dispatching, excessive overtime, low pricing discipline, many non-billable hours |
Below average | 55–65 percent billable utilization | 30–40 percent | 3–8 percent | Inconsistent scheduling, long commuting time, average first-time fix rate, limited technician accountability |
Average | 65–75 percent billable utilization | 40–50 percent | 8–12 percent | Reasonable scheduling, manageable callbacks, consistent technician performance, acceptable job costing |
Good | 75–85 percent billable utilization | 50–60 percent | 12–18 percent | Efficient dispatching, high first-time fix rate, low downtime, strong job planning, effective performance tracking |
Excellent | 85 percent+ billable utilization | 60–70 percent | 18–25 percent | Optimized scheduling, minimal callbacks, excellent technician utilization, recurring maintenance revenue, disciplined pricing, technology-driven operations |
Factor #2: Overhead control
Even profitable jobs can produce disappointing bottom-line results if you don’t keep your overhead costs under control.
Here’s a table that shows how different overhead structures typically affect gross and net profit margins.
Overhead Category | Typical Percentage of Revenue | Impact on Gross Margin | Impact on Net Margin | Operational Impact |
Office / Administrative Payroll | 6–12 percent | Minimal direct impact | Very high impact | Excess CSR, dispatch, accounting, or management staffing can quickly compress net profits |
Marketing & Lead Generation | 5–10 percent | Minimal direct impact | High impact | High acquisition costs reduce profitability if leads don't convert into profitable jobs or recurring customers |
Fleet Costs (fuel, leases, maintenance, insurance) | 3–7 percent | Minimal direct impact | High impact | Poor routing, aging vehicles, and excessive idle time increase operating costs per truck |
Management Salaries | 3–8 percent | Minimal direct impact | High impact | Too many managers or unclear responsibilities increase overhead without improving productivity |
Rent & Facilities | 1–4 percent | Minimal direct impact | Moderate impact | Oversized offices, shops, or warehouses increase fixed costs that must be covered year-round |
Software & Technology | 1–3 percent | Minimal direct impact | Low to Moderate impact | The right software can reduce administrative costs and improve productivity, while overlapping tools add unnecessary expense |
Insurance (workers’ comp, vehicle, liability) | 2–5 percent | Minimal direct impact | Moderate to high impact | Claims history, fleet size, and safety performance significantly influence insurance premiums |
Training & Recruiting | 1–3 percent | Minimal direct impact | Low short-term, high long-term impact | Investing in hiring and technician development increases costs initially but often improves retention and productivity |
Call Center / CSR Operations | 2–6 percent | Minimal direct impact | High impact | Understaffed teams lose revenue opportunities, while overstaffed teams inflate overhead |
Owner Compensation & Draws | 3–10 percent | Minimal direct impact | High impact | Excessive owner compensation can distort profitability and reduce retained earnings available for growth |
Financing / Interest Expense | 0.5–3 percent | No direct impact | Moderate impact | High debt payments reduce cash flow and erode net profit, particularly during slower seasons |
Warehouse / Inventory Carrying Costs | 1–3 percent | Minimal direct impact | Moderate impact | Overstocking ties up cash, while poor inventory management leads to waste, obsolescence, and emergency purchases |
That said, how much overhead eats into your revenue largely varies depending on your HVAC business model.
New construction contractors, for example, generally operate with lower margins and leaner overhead. Residential service companies, on the other hand, tend to carry higher overhead to support functions like marketing and customer service, but they can usually offset those costs with stronger gross and net margins.
HVAC Business Type | Typical Total Overhead Percentage of Revenue | Typical Net Margin |
New construction HVAC | 20–35 percent | 2–8 percent |
Commercial HVAC service | 25–35 percent | 8–15 percent |
Residential HVAC service & replacement | 30–45 percent | 10–20 percent |
Highly optimized residential operators | 35–50 percent | 18–25 percent |
Factor #3: Pricing and gross margin management
Disciplined pricing allows HVAC operators to protect margins while remaining competitive in the market.
The table below shows how different pricing strategies typically influence gross and net profit margins.
Typical Pricing Discipline | Approx. Gross Profit Margin | Approx. Net Profit Margin | Common Characteristics |
Reactive / competitor-based pricing | 20–35 percent | -5 percent to 3 percent | Underbidding jobs, inconsistent markups, discount-heavy sales, poor job costing |
Basic markup structure | 35–45 percent | 3–8 percent | Simple cost-plus pricing, inconsistent application across technicians, limited tracking of actual job profitability |
Standardized pricing processes | 45–55 percent | 8–15 percent+ | Defined pricing guides, structured estimates, improved consistency across jobs, more awareness of labor burden |
Strong gross margin management | 55–65 percent | 12–20 percent+ | Tight control of job costing, regular margin reviews, disciplined change order tracking, KPI-driven pricing adjustments |
Premium value-based pricing | 60–70 percent+ | 18–25 percent+ | Pricing based on value and expertise, strong differentiation, minimal discounting, high trust and brand positioning |
Factor #4: Recurring maintenance
Unlike one-off service calls or project work, maintenance agreements create predictable revenue and reduce dependency on seasonal demand swings.
In the table below, we show how profit margins typically change based on the percentage of customers enrolled in recurring maintenance agreements and why those differences matter in day-to-day operations.
Percentage of Customers Signing Up for Recurring Maintenance | Approx. Gross Profit Margin | Approx. Net Profit Margin | Common Characteristics |
0–5 percent | 25–40 percent | -5 percent to 5 percent | Highly seasonal revenue, inconsistent technician workload, heavy reliance on emergency calls and paid advertising |
5–15 percent | 35–45 percent | 3–8 percent | Early-stage maintenance adoption, still reactive-heavy business, limited scheduling predictability, improving but unstable cash flow |
15–30 percent | 45–55 percent | 8–15 percent | Noticeable shift toward planned work, better technician use, reduced emergency dependency, improving customer retention |
30–50 percent | 55–65 percent | 12–20 percent | Balanced mix of maintenance and service work, stable scheduling, stronger forecasting ability, and higher operational efficiency |
50–70 percent+ | 65–75 percent | 8–30 percent+ | Maintenance-driven business model, highly predictable revenue, optimized routing, strong retention, and reduced marketing pressure |
Factor #5: Customer acquisition efficiency
When it takes too much to acquire a job relative to its lifetime value, margins shrink before the work even begins.
Here’s a table showing how profit margins typically change based on customer acquisition cost (CAC) levels and what those costs mean.
Typical Customer CAC as Percentage of Revenue | Approx. Gross Profit Margin | Approx. Net Profit Margin | Common Characteristics |
20–35 percent+ | 35–50 percent | -5 percent to 3 percent | Heavy dependence on paid leads, weak call conversion, low referral business, aggressive discounting |
15–20 percent | 40–55 percent | 3–8 percent | Still paid-lead heavy, improving conversion rates, inconsistent referral flow, moderate sales efficiency |
10–15 percent | 45–60 percent | 8–15 percent | Balanced marketing mix, growing repeat customers, improving brand presence, better call handling and close rates |
6–10 percent | 55–65 percent | 12–20 percent | Strong referral engine, efficient sales process, high close rates, reduced dependency on paid ads |
3–6 percent | 60–75 percent | 18–30 percent+ | Dominant word-of-mouth and repeat business, strong brand equity, highly optimized sales funnel, minimal marketing waste |
Bonus Factor: Seasonality
Without proper operational systems, businesses heavily exposed to seasonal swings will typically struggle with uneven cash flow during the off-season.
The table below breaks down how HVAC profitability may change based on seasonal workload, and why those differences occur.
Typical Revenue Stability Throughout Year | Approx. Gross Profit Margin | Approx. Net Profit Margin | Common Characteristics |
Highly seasonal / weather-dependent | 25–40 percent | -10 percent to 3 percent | Revenue spikes only during extreme weather, layoffs during slow months, underused technicians |
Moderate seasonal swings | 35–50 percent | 3–8 percent | Some seasonal peaks, but basic maintenance work smooths demand slightly; still reliant on weather-driven calls |
Some off-season stability | 45–55 percent | 8–15 percent | Growing maintenance base, more predictable scheduling, fewer extreme revenue fluctuations |
Strong year-round workload | 50–65 percent | 12–20 percent | Balanced mix of service, installs, and maintenance contracts; consistent technician utilization |
Highly stable recurring revenue | 60–75 percent | 18–30 percent+ | Maintenance-heavy model, predictable cash flow, optimized routing and staffing, minimal seasonality impact |
Next, let’s take a look at the various reasons HVAC contractors may experience much lower profit margins.
Which Factors Kill HVAC Profit Margins?
Margins in HVAC don’t usually disappear in one big moment. Instead, they leak out through everyday operational breakdowns that are easy to overlook:
Callbacks and warranty rework
Inventory leakage
Poor dispatching and routing
Low average ticket size
Weak call conversion performance
Factor #1: Callbacks and warranty rework
Callbacks and warranty rework are one of the fastest ways HVAC margins disappear. Every return visit means paying labor twice, rescheduling other revenue-generating jobs, and absorbing additional overhead without new income.
And beyond the direct costs (leading to margin losses as high as 15 percent) frequent callbacks also damage customer trust and reduce technician efficiency.
Factor #2: Inventory leakage
Inventory leakage happens when parts are used but not properly tracked or billed. This is especially common with small items like filters, fittings, or refrigerant that often slip through unnoticed, especially when taken from van stock.
Over time, these 'invisible' costs accumulate and quietly reduce gross margin by up to 10 percent on otherwise profitable jobs.
Factor #3: Poor dispatching and routing
Inefficient scheduling leads to wasted drive time, missed appointments, and uneven technician workloads. And when trucks are poorly routed, technicians spend more time on the road than on billable work.
This reduces daily job capacity and increases fuel, labor, and total costs without increasing revenue.
Factor #4: Low average ticket size
Low average ticket size forces technicians to complete more jobs just to hit revenue targets. This increases travel time, scheduling complexity, and operational strain.
Without effective upselling or diagnostic selling, even busy schedules can translate into margin cuts of 10 to 20 percent.
Factor #5: Weak call conversion performance
If you’re not converting calls, you’re missing revenue opportunities. Every unbooked call represents lost labor capacity, wasted marketing spend, and reduced return on lead generation.
Poor call handling, slow follow-ups, or a lack of structured sales processes can significantly reduce overall business profitability by as much as 25 percent.
So how do you increase your HVAC profit margins? We discuss a step-by-step playbook below.
A Three-Tiered Process for Improving HVAC Profit Margins
Tier 1: Assessing Your Current Revenue and Profit Margins and Setting Goals to Improve Them
The most successful HVAC contractors that we work with at ServiceTitan, both within our organization and the HVAC businesses we serve, have a process in place to assess the current state of their operational and financial KPIs and set goals to improve them.
Typically, this means annual planning that involves:
Reviewing how their business performed during the year prior
Setting operational and financial goals for the upcoming year
Regardless of whether you’re a small business or an enterprise, this essential step establishes the foundation for improving your profit margins. After all, you need to know where your numbers are before you set goals for where you want them to go:
Are your gross margins below target benchmarks? This indicates pricing or job costing issues.
Are your technicians experiencing high idle time or low utilization? This may signal scheduling inefficiencies.
Are you getting frequent callbacks or repeat visits per job? This points to quality or process gaps.
Is your overhead rising without matching revenue growth? You may have structural inefficiency.
Is your average ticket size low despite steady call volume? This suggests missed upsell or pricing opportunities.
While annual planning takes different shapes and forms, setting financial goals typically involves:
Looking at high-level KPIs for the previous year, broken down for each department. For example: sales, gross margin, total completed service calls, sales per job, total crews/HVAC technicians, total calendar days worked, sales per crew/tech, completed jobs per crew/tech per day.
Looking at total revenue per month for each department, and setting a percentage increase goal for the upcoming year. This gives you specific revenue and gross profit targets for each department that you can use to see how you’re pacing toward your goals.
Determining lead requirements to hit your revenue and profit goals. This involves reviewing lead KPIs from the previous year (e.g., average ticket amount, number of sales, close rate, etc.) and reverse engineering how many leads you’ll need to hit your goals.
Once you’ve reviewed your numbers, set your revenue and profit goals, and determined the specific targets you need to achieve in order to hit those goals, you simply track your progress for each department to see how you’re performing and pacing towards your sales, gross profit, and net profit goals.
Key Consideration: Where Do You Get This Data?
Doing this sort of detailed annual review requires capturing and recording this data throughout the year. Depending on what tools you use in your business, this can be more or less demanding and time-intensive.
If you’re primarily using spreadsheets and/or disparate software solutions for different aspects of your business (e.g., a platform for call booking, a platform for estimating and invoicing, a platform for inventory and accounting, etc.), doing the above type of analysis can be a challenging process. You’ll likely find yourself consolidating data from different platforms, doing manual data entry, double-checking your data inputs, etc.
In contrast, for HVAC service businesses using field service software (like ServiceTitan), this process is streamlined. For example, in ServiceTitan, if you want to view high-level KPIs, such as total revenue or total sales for the past year, you can pull these metrics up almost instantly by adjusting the date range to the previous 365 days on your main dashboard:


This is one of many reasons why leading HVAC contractors are adopting HVAC software like ServiceTitan, which centralizes all of your operational data into one place and offers robust dashboard and reporting tools. This makes annual reviews and ongoing tracking of KPIs a streamlined experience.
Tier 2: Ongoing Tracking of KPIs and Pacing Toward Your Profit Targets
When it comes to the ongoing tracking of KPIs and pacing toward revenue goals, it’s useful to have daily as well as monthly routines.
For example, if you’re the business owner, you can benefit from a simple daily report to see how many calls you had for the day, how much revenue came in, and how you’re pacing toward the end of the month. Then, at the end of each month, you should also do a full financial review with your bookkeeper or accountant (and then your leadership team) to get full clarity on how you performed in relation to your goals. This is crucial for making any necessary adjustments throughout the year to hit those year-end goals.
Here’s a table that highlights six important KPIs HVAC business owners should review each week to monitor operational performance and track their revenue and profit goals.
KPI | What It Measures | Why It Matters | Strong Benchmark |
Revenue vs. Weekly Goal | Actual revenue generated compared to the weekly target | Shows whether the business is pacing toward its monthly and annual revenue goals | 100 percent+ of weekly target |
Gross Profit Margin | Revenue remaining after direct job costs | Indicates whether jobs are being priced and executed profitably | 55–65 percent (service) |
Billable Technician Utilization | Percentage of technician hours spent on billable work | Higher utilization means more revenue without increasing headcount | 80–85 percent+ |
Average Ticket Size | Average revenue generated per completed job | Reflects technicians' ability to identify additional work and maximize each service call | Increasing month over month; meets company target |
Maintenance Agreement Sales | Number or percentage of customers enrolled in recurring maintenance | Builds predictable revenue, improves retention, and reduces seasonality | Offer on 100 percent of eligible calls; 40–60 percent+ customer penetration |
Callback Rate | Percentage of completed jobs requiring a return visit | Frequent callbacks consume labor, increase costs, and reduce customer satisfaction | Below 5 percent |
If you’re a CSR manager, you should be looking at more detailed daily numbers such as call booking rates, number of outbound calls, number of inbound calls, etc.
However, the ease of collecting and accessing this data depends on what tools and apps you use.
With ServiceTitan, HVAC business owners and managers can customize their own dashboards and reports to monitor all of this data with ease.
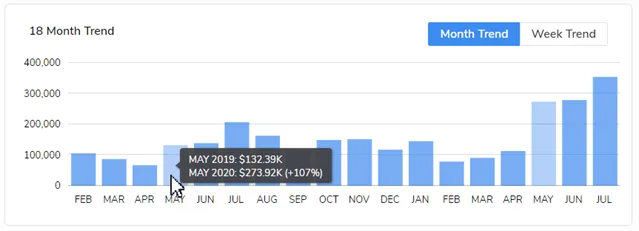
For example, Revenue Trends by month or week can be viewed as bar or line graphs. By hovering over a given month or week, users can instantly see year-over-year revenue comparisons.

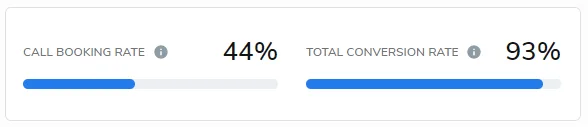
The Company Metrics portion of the dashboard shows sales, revenue, bookings, conversion numbers, and more:
Total sales
Closed average ticket price
Completed revenue
Average revenue per job opportunity
Revenue from counter sales, membership, and progress billing
Revenue from adjustment invoices added to jobs


Metrics on the main dashboard also include call-booking rate and total conversion rate, plus:
Customer satisfaction
Total cancellations
Membership opportunities converted

In addition to these high-level KPIs, the ServiceTitan dashboard provides HVAC business owners and administrators with valuable insights into employee and operational performance.
For example, the Call Metrics section of the dashboard features a chart, arranged as a function of call date, documenting inbound call booking rates. Below the chart, you’ll find call lead totals and the jobs booked from those leads.


Information about calls that were abandoned or did not result in a booking is no less valuable. And the Call Metrics section also offers a wealth of intelligence on these calls:
Length
Timestamp
Caller phone number
Number dialed
Employee who took the call

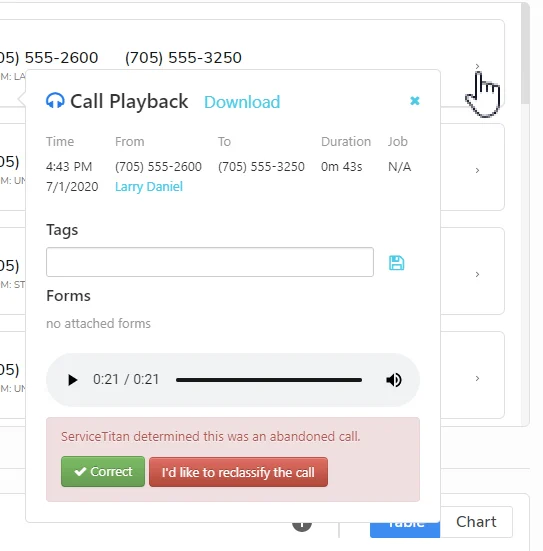
To review past calls, whether they resulted in a booking or not, ServiceTitan offers a Call Playback feature. Here, users can listen to recordings of calls.
ServiceTitan’s Call Playback functionality is useful for field service technicians who want to verify job details or customer information via the ServiceTitan mobile app, as well as for supervisors, who can use it to confirm that CSRs are providing good customer support and following best practices in interactions with clients.
In contrast to tracking these metrics in spreadsheets and different apps, ServiceTitan makes it simple to access the data, and therefore empowers business owners, managers, and employees to actually use these tools and follow these best practices of ongoing KPI tracking, which proves invaluable for improving profit margins.
Once you’ve reviewed your current performance, set goals, and set forth tracking progress toward your goals, the final tier is to optimize for maximum efficiency throughout the rest of your business.
Tier 3: Optimizing for Efficiency, Implementing Best Practices, and Empowering Your Team to Achieve Maximum Performance
Goal setting and tracking establish the foundation that HVAC businesses need to begin improving their profit margins. However, optimizing for efficiency and implementing best practices in your business is how you begin to hit and exceed those profit goals.
We’ve written at length about the key actions that HVAC businesses can take to improve their operations and bottom line, and how ServiceTitan can help implement best practices and facilitate efficiency throughout organizations.
Here are some of our top articles discussing how you can improve your margins:
How to Price an HVAC Job: HVAC Pricing Guide for Contractors: Incorrect pricing is probably the biggest reason why HVAC businesses often have low profit margins. This guide will help you understand how to price your residential or commercial HVAC services for profitability. It covers flat-rate versus time and materials pricing, three key factors for pricing correctly, and how ServiceTitan streamlines pricebook management.
How to Design a World-Class HVAC Sales Process: Too often, HVAC companies lack a well-defined sales process that enables their team to convert more of the leads they already have, and which ensures they’re not leaving any money on the table. This post will help you understand how to empower your technicians to increase HVAC system sales (from air conditioning units to heat pumps) as well as HVAC repair services. It includes a step-by-step breakdown of an ideal system-replacement sales call for CSRs and office staff, how to do proper follow-up, and more.
How to Streamline HVAC Service Agreements (With Free Template): Offering HVAC maintenance contracts can be highly beneficial for maintaining cash flow during shoulder seasons. However, running a service agreement program has its challenges. This post discusses those challenges and how ServiceTitan can help solve them.
16 HVAC Marketing Strategies That Make Companies Stand Out: The ability to generate new customers through marketing is a key asset for HVAC companies that want to grow their business. This post shares best-practice strategies to reach more businesses and homeowners and turn them into customers.
Get a ServiceTitan Demo to See How We Can Help You Optimize and Grow Your HVAC Business
Using a best-in-class HVAC software platform like ServiceTitan gives contractors the tools they need to maintain full visibility into their business and empower their teams for growth.
In addition to the dashboard and reporting features discussed above, our software offers tools to facilitate the entire HVAC business workflow, including:
Want to see how ServiceTitan’s HVAC software can streamline operations and grow your business? Schedule a call for a free product tour.


Frequently Asked Questions (FAQs)
Q1. What is the difference between gross margin, operating margin, and net margin?
Gross margin measures revenue left after direct job costs like labor, materials, and subcontractors. It reflects how profitable individual jobs are.
Operating margin goes a step further by subtracting overhead costs such as office staff, rent, marketing, insurance, and software. It shows how efficiently the business operates.
Net margin is what remains after all expenses, including taxes and interest. It represents the true bottom-line profit of the business.
Q2. How do HVAC margins compare to other trades?
HVAC margins are generally stronger than general contracting but comparable to plumbing and electrical when well-managed. However, larger commercial construction HVAC companies typically work with lower margins compared to residential HVAC providers due to competitive bidding and tighter contract structures.
Q3. What costs determine HVAC profit margins?
HVAC profit margins are primarily shaped by three cost categories:
Direct job costs (cost of goods sold): labor, materials, subcontractors, permits, and equipment rentals
Overhead costs: office payroll, marketing, fleet, insurance, rent, software, and administration
Financing and operating costs: interest payments, credit facilities, and other financial expenses
Together, these determine how much of each dollar earned flows down to net profit.
Q4. How do you calculate HVAC profit margins correctly?
HVAC profit margins are calculated using two core formulas:
Gross Margin = (Revenue – Cost of Goods Sold) ÷ Revenue × 100
Net Margin = Net Profit ÷ Revenue × 100
To get an accurate picture of business performance, these margins should not be calculated only at the company level. HVAC businesses should track margins at three levels:
Per-job margin to understand which jobs are profitable or losing money.
Per-department margin (service, installation, maintenance, commercial) to identify structural strengths and weaknesses.
Company-wide margin to evaluate overall financial health and long-term sustainability.
Without separating these layers, profitable workstreams can mask unprofitable ones and distort decision-making.
ServiceTitan HVAC Software
ServiceTitan is a comprehensive HVAC business software solution built specifically to help service companies streamline their operations, boost revenue, and achieve growth. Our award-winning, cloud-based platform is trusted by more than 100,000+ contractors across the country.


