


With persistent inflation, rising labor costs, and continued material price volatility, the topic of electrical business profitability and how to improve profit margins has been a consistent area of interest and concern for our customers and the electrical contractors within our network.
Specifically, electrical contractors and subcontractors often find themselves in the difficult circumstances of:
Getting to the end of the year only to realize they made a fractional 2% or 3% net profit, or worse (and not uncommon) — ending the year at a loss.
Spending the majority of their time relatively blind as to how their gross profit margins are performing and how they’re pacing toward their profit goals.
Wanting to take control of and improve their profit margins, but lacking the right process or tools to do so.
In this post, we provide a clear, three-tiered process for solving these challenges in an electrical business, based on interviews with our electrical industry experts at ServiceTitan. The most successful businesses in the electrical industry are using processes like the one laid out below to navigate these challenging times and maintain healthy, profitable companies.
Before we get into the tiered process, let's examine some common questions about electrical profit margins.
Want to see how ServiceTitan can help you protect your margins and grow the bottom line for your electrical business? Schedule a call today.
What Is a Good Net Profit Margin for an Electrical Business?
A good average net profit margin for electricians is typically between 10% and 20%. Exact percentages will depend on the size of the business, market conditions, and operating efficiency.
That said, the 10% to 20% range is by no means the average profit margin.
Many businesses often operate at under 10%, and in many cases, net profit margins are as low as 2% to 3%. This is a vulnerable place to be, considering all of the costs and risks associated with running an electrical company. Not to mention, contractors operating at this level are not being compensated commensurate with their effort and risk.
From our perspective, electrical contractors should strive to garner a 20% profit margin after subtracting their direct costs (labor, equipment, and materials costs) and operating expenses (business insurance, taxes, office supplies, and other overhead expenses) from their revenue.
Whatever your current net profit margin is, the following process to improve your margins will be a crucial step in the right direction.
Note: One exception to the 10% to 20% rule above is for electrical businesses that are in a start-up phase, focused on acquiring new customers. In these cases, they may intentionally choose to invest in marketing and customer acquisition instead of net profit.
Which Factors Impact Electrical Contractor Profit Margins?
Many factors influence profit margins for electrical contractors, but the biggest drivers typically fall into five categories:
Labor productivity
Market segment
Overhead structure
Pricing
Annual revenue
Together, these factors determine how efficiently an electrical business converts revenue into profit.
Factor #1: Labor productivity
The more efficiently technicians complete billable work, the more revenue the business generates without proportionally increasing labor costs. And at lower productivity levels, revenue drops.
Here’s a table on how different productivity levels impact the profit and why.
Labor Productivity Level | Typical Technician Utilization | Operational Characteristics | Estimated Net Profit Margin |
Very low | <60% billable utilization | Frequent downtime, poor scheduling, high rework, weak estimating, excessive callbacks | 0–3% |
Low | 60–70% billable utilization | Inconsistent scheduling, moderate rework, underpriced jobs, technicians spend too much time driving or waiting | 3–7% |
Average Industry | 70–80% billable utilization | Generally efficient operations, acceptable scheduling, manageable callbacks, average estimating accuracy | 8–12% |
Strong | 80–85% billable utilization | Well-managed dispatching, accurate estimating, low callback rates, high first-time fix rate, standardized workflows | 12–18% |
High-Performance | 85–90% billable utilization | Optimized scheduling, minimal downtime, strong field-office coordination, effective KPI tracking, proactive capacity management | 18–25% |
Elite / Specialized | 90%+ billable utilization | Highly optimized operations, premium pricing, exceptional technician efficiency, specialized expertise, technology-driven workflows | 25%+ |
The #1 newsletter for the trades.
Factor #2: Market segment
The market segment an electrical contractor operates in has a direct impact on profit margins because not all work carries the same pricing power or cost structure.
Here’s a table depicting what that looks like.
Market Segment | Typical Work | Competition Level | Typical Net Profit Margin |
Large Commercial Construction | Office buildings, retail centers, schools, tenant build-outs | Very high (competitive bidding) | 2–6% |
Small/Medium Commercial | Local businesses, offices, small retail, light commercial upgrades | High but more flexible than large bids | 5–12% |
Residential New Construction | New homes, subdivisions, wiring for developers and builders | High (price-driven, volume-based) | 4–10% |
Residential Service & Repair | Troubleshooting, panel upgrades, emergency repairs, rewiring | Medium to high (local competition) | 10–25% |
Industrial Electrical | Factories, plants, heavy machinery wiring, power systems | Medium (specialized skill barrier) | 8–18% |
Industrial Specialty / Automation | Controls, PLC systems, robotics, advanced automation setups | Medium to low (high specialization) | 15–30% |
Maintenance Contracts | Recurring service agreements, inspections, preventive maintenance | Low to medium (sticky recurring revenue) | 15–35% |
Government / Public Projects | Schools, infrastructure, municipal buildings, public facilities | High (regulated bidding processes) | 3–8% |
Healthcare / Mission-Critical | Hospitals, labs, data centers, backup power systems | Low (high compliance + specialization barriers) | 12–25% |
Renewable Energy / EV Infrastructure | Solar installations, EV charging stations, grid integration work | Medium (rapidly growing but competitive) | 10–20% |
Factor #3: Overhead structure
Costs like office staff, vehicles, insurance, software, rent, tools, and administrative expenses all contribute towards your overhead, which directly affects how much revenue is required just to keep the business running.
Here’s a table depicting how various overhead structures can affect profit margins.
Overhead Structure | Typical Overhead as % of Revenue | Operational Characteristics | Typical Net Profit Margin |
Very Lean | 10–15% | Small admin team, owner-operated, minimal office/shop costs, efficient systems | 15–25% |
Lean | 15–20% | Small but structured admin team, controlled fleet costs, basic office/shop setup, some software systems in place | 12–18% |
Average Industry | 20–30% | Moderate admin overhead, growing team structure, standard office/shop costs, some inefficiencies in processes and scheduling | 8–15% |
Heavy | 30–40% | Larger office staff, higher vehicle/fleet expenses, underutilized technicians, inefficient scheduling and duplicated admin work | 4–10% |
Very Heavy | 40%+ | Bloated admin structure, poor cost control, excess overhead spending, weak systems integration, low operational efficiency | 0-5% |
Factor #4: Pricing strategy
Pricing strategy determines how effectively labor, materials, and overhead are converted into profit. And businesses that adopt value-based or fully loaded pricing models are better able to protect profitability and account for real-world costs.
The table below shows how various pricing strategies impact profit margins.
Pricing Strategy | Typical Pricing Characteristics | Competition Position | Estimated Net Profit Margin |
Aggressive Low-Bid Pricing | Competing mainly on lowest price, thin markups, frequent underbidding | Commodity/high competition | 0–3% |
Below-Market Pricing | Slightly under market rates to win volume, limited markup discipline, reactive estimating | Price-sensitive, volume-driven work | 3–8% |
Average Market Pricing | Pricing aligned with market rates, moderate markup consistency, some job costing discipline | Balanced competition | 8–15% |
Strong Value-Based Pricing | Pricing based on value, scope clarity, labor efficiency factored into estimates, consistent markup rules | Differentiated, service-focused | 15–25% |
Premium / Specialized Pricing | High-margin pricing for niche expertise, complex systems, compliance-heavy or mission-critical work | Low competition / high skill barrier | 20–35% |
Factor #5: Annual revenue
The scale of your annual revenue affects both efficiency and cost structure. As revenue grows, contractors can spread fixed overhead costs across a larger base of work, often improving overall margins.
Here’s a table that depicts how annual revenue levels correlate with competitive positioning and typical net profit margins.
Annual Revenue | Typical Company Profile | Competition Position | Estimated Net Profit Margin |
Under $500K | Competing mainly on lowest price, thin markups, frequent underbidding | Owner-operated, minimal overhead, highly dependent on owner labor | 10–25% |
$500K–$2M | Small team, some admin support, informal systems, inconsistent job costing | Local competition, mixed pricing discipline | 8–18% |
$2M–$5M | Structured team, dispatcher/admin support, basic processes and KPIs emerging | Balanced competition, improving pricing control | 8–15% |
$5M–$15M | Established departments, defined roles, use of software systems, growing operational discipline | Competitive but more value-driven positioning | 10–18% |
$15M–$50M | Multi-team operations, formal processes, strong overhead structure, management layers | Differentiated competitors, efficiency-focused | 12–20% |
$50M–$150M | Enterprise-level structure, regional branches, advanced systems and reporting | Strongly process-driven competition, scale advantages matter | 10–18% |
$150M+ | Large enterprise, multi-location operations, sophisticated financial and operational systems | Highly strategic, national-scale competition | –15% |
What Gross Profit Margin Should an Electrical Company Target Across Their Services?
According to our industry expert Bill Powers, electrical businesses should be shooting for an average gross profit margin of 65% to 67% across their services. In most well-run operations, this level of gross margin typically supports a net profit margin of around 17% to 20%, depending on overhead efficiency and pricing discipline.
On one hand, gross profit margins help businesses measure performance in each of their different departments (such as electrical installation, service and repair, maintenance, new construction, etc.)
And on the other hand, gross profit margins reflect the overall health across the entire business, after all overhead and operating costs are accounted for.
Now, before we explore how to improve your electrical profit margins, let us first highlight some of the issues causing your current low profit margins.
Top 5 Electrical Contractor Profit Margin Killers
Profit margins in electrical contracting fall due to a combination of operational and financial issues that quietly erode profitability over time.
Here are the five most common margin killers to watch out for.
Factor #1: Poor estimation
Bad estimates quietly destroy profitability before the job even starts. Here’s what that often looks like:
Underestimating labor hours
Missing scope items
Low or inconsistent markup
Inaccurate material takeoffs
Ignoring labor burden
Factor #2: Low labor productivity
When technicians aren’t fully productive, profitability erodes quickly. This may show up as:
Time wasted waiting for materials
Inefficient routing or excessive driving
Poor supervision or coordination
Frequent downtime between tasks
Factor #3: Rework and callbacks
Every callback means paying for the same job twice. Beyond labor costs, it also means:
Disrupted schedules
Low customer satisfaction
Additional overhead costs
Factor #4: Overhead bloat
Without proper control, overhead expenses can quietly explode as your company grows. Common drivers include:
Office staff expansion
Additional managers
Fleet and vehicle costs
Software subscriptions
Warehouse and insurance costs
Factor #5: Poor operations management
Small inefficiencies compound across dozens of jobs, leading to lower profit margins. Some recurring issues include:
Relying on verbal approvals only
Undocumented change orders
Delayed billing cycles
Scope creep
Untracked “small favors” in the field
Now that you know what the margin killers are, let us examine the other side of the equation. The practical way contractors systematically improve profitability across their electrical service delivery.
A 3-Tiered Process for Improving Electrical Profit Margins
Tier 1: Assessing Your Annual Revenue and Profit Margins and Setting Goals to Improve Them
The most successful electrical contractors that we work with at ServiceTitan — within our organization and the electrical businesses we serve — prioritize assessing the current state of their operational and financial KPIs, and setting goals to improve them.
For annual planning, this typically involves:
Reviewing how their business performed during the year prior
Setting operational and financial goals for the upcoming year
Whether you’re a small business or you’re at the enterprise level, this essential step establishes the foundation for improving your profit margins. After all, you need to know where your numbers are before you can set goals for where you want them to go.
Look at high-level KPIs for the previous year, broken out by each department. For example: sales, gross margin, total completed service calls, sales per job, total crews/electrical technicians, total calendar days worked, sales per crew/tech, completed jobs per crew/electrician per day.
Look at total revenue per month for each department, and set a percentage increase goal for the upcoming year. This gives you specific revenue and gross profit targets for each department that you can use to see how you’re pacing toward your goals.
Determine lead requirements to hit your revenue and profit goals. This involves reviewing lead KPIs from the previous year (e.g. average ticket amount, number of sales, close rate, etc.), and reverse engineering how many leads you’ll need to hit your goals.
Once you’ve reviewed your numbers, set your revenue and profit goals, and determined the specific targets you need to hit those goals, you simply track your progress for each department to see how you’re performing and pacing toward your sales, gross profit, and net profit goals.
Key Consideration: Where Do You Get This Data?
Doing this sort of detailed annual review requires capturing and recording this data throughout the year. Depending on what tools you use in your business, this can be more or less demanding and time-intensive.
If you’re primarily using spreadsheets and/or disparate software solutions for different aspects of your business (e.g., a platform for call booking, another one for estimating and invoicing, a different platform for inventory and accounting, etc.), consolidating data, doing manual data entry, and double-checking your data inputs can be an overwhelming process.
In contrast, for electrical service businesses using field service software such as our platform, ServiceTitan, this process is significantly more streamlined.
For example, in ServiceTitan, if you want to view high-level KPIs such as total revenue or total sales for the past year, you can pull these metrics up by simply adjusting the date range to the previous 365 days on your main dashboard:


This is one of many reasons why leading electrical contractors are adopting electrical software like ServiceTitan, which centralizes all of your operational data into one place and offers robust dashboard and reporting tools to streamline annual reviews and ongoing tracking of KPIs.
Tier 2: Ongoing Tracking of KPIs and Pacing Toward Your Profit Targets
When it comes to the ongoing tracking of KPIs and pacing toward revenue goals, it’s useful to implement daily as well as monthly routines.
For example, if you’re the business owner, a simple daily report to see how many calls you had for the day, how much revenue came in, and how you’re pacing toward the end of the month is crucial data.
Then, at the end of each month, you should also do a full financial review with your bookkeeper or accountant (and subsequently your leadership team) to get full clarity on how you performed in relation to your goals. This is crucial for making any necessary adjustments throughout the year to hit those year-end goals.
Meanwhile, if you’re a CSR manager, you should be looking at more detailed daily numbers such as call booking rates, number of outbound calls, number of inbound calls, etc.
Again, the ease of collecting and accessing this data will depend on what tools and apps you use. Facilitating the ongoing tracking of KPIs is an area where field service reporting software can be absolutely transformative for electrical businesses.
With ServiceTitan, owners and managers can customize their own dashboards and reports to monitor all of this data in real-time with ease.
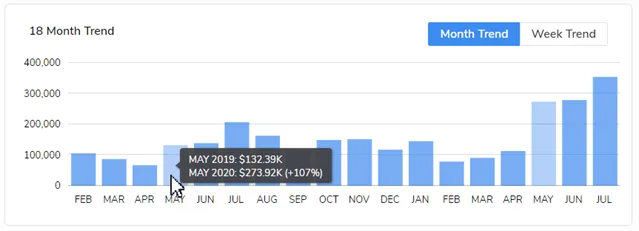
For example, Revenue Trends by month or week can be viewed as bar or line graphs. By hovering over a given month or week, users can instantly see year-over-year revenue comparisons.

The Company Metrics portion of the dashboard shows sales, revenue, bookings, conversion numbers, and more:
Total sales
Closed average ticket price
Completed revenue
Average revenue per job opportunity
Revenue from counter sales, and membership and progress billing
Revenue from adjustment invoices added to jobs


Metrics on the main dashboard also include call-booking rate and total conversion rate, plus:
Customer satisfaction
Total cancellations
Membership opportunities converted


In addition to these high-level KPIs, the ServiceTitan dashboard provides electrical business owners and administrators with valuable insights on employee and operational performance.
For example, the Call Metrics section of the dashboard features a chart, arranged as a function of call date, documenting inbound call booking rates. Below the chart, users will find call lead totals and the jobs booked from those leads.


Information about calls that were abandoned or did not result in a booking is also important. And the Call Metrics section offers detailed insights on these calls:
Length
Timestamp
Caller phone number
Number dialed
Employee who took the call
Call Playback in ServiceTitan

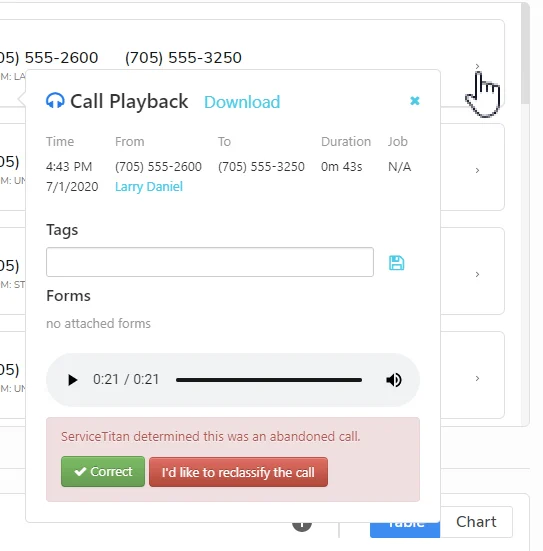
For further information about past calls — whether they resulted in a booking or not — ServiceTitan offers a Call Playback feature. Here, users can listen to recordings of calls.
This functionality is useful for field service technicians who want to verify job details or customer information via the ServiceTitan mobile app, as well as for supervisors, who can use it to confirm that CSRs are providing good customer support and following best practices in interactions with clients.
In contrast to tracking these metrics in spreadsheets and different apps, ServiceTitan makes it simple to access this data, and therefore empowers business owners, managers, and employees to actually use these tools and follow these best practices of ongoing KPI tracking.
Now, once you’ve completed tiers 1 and 2 — you’ve reviewed your current performance, set goals, and set forth tracking progress toward your goals — the final tier is to optimize for maximum efficiency and implement best practices throughout the rest of your business.
Tier 3: Optimizing for Efficiency, Implementing Best Practices, and Empowering Your Team to Achieve Maximum Performance
Goal setting and tracking sets the foundation that electrical contracting businesses need to begin improving their profit margins. However, optimizing for efficiency and implementing best practices in your business is how you begin to actually hit and exceed those profit goals.
We’ve written at length about the key actions that electrical businesses can take to improve their operations and their bottom line, and how ServiceTitan can help facilitate efficiency and implement best practices throughout organizations. So, here we’ll share links to some of our top articles that can help you become a more profitable electrical business.
Here are some articles discussing how to become a profitable electrical business:
How to Price Electrical Work for Profit and Growth: Incorrect pricing is probably the biggest reason why electrical businesses often have low profit margins. This guide will help you understand how to price your electrical services for profitability. It discusses how flat-rate pricing improves profitability, while actually providing better customer experiences, and key factors that electricians need to consider when calculating their pricing (labor rate, billable hours, overhead costs, etc.).
How to Grow Your Electrical Business: The Ultimate Guide to Operations, Marketing, and More: Electrical business owners looking to grow their business can come across a lot of conflicting advice online. To help electrical business owners find useful strategies to grow their businesses and increase their bottom line, ServiceTitan spoke to a range of highly successful home service industry experts and users of our electrical service management software. From those conversations, we have assembled this collection of strategies and tactics for growing an electrical business, whether you're a startup or an established small business.
Revisit Your Electrical Contracting Business Plan Every Year to Fuel New Growth: This post provides an in-depth walk-through of how to create an electrical business plan section by section.
Top Electrician Marketing Tips: The Ultimate Guide to Electrical Advertising: The ability to generate new customers through marketing is a key skill for electrical companies that want to grow their business. This post shares best-practice marketing strategies to reach more potential customers, from homeowners to local businesses to larger commercial accounts. It covers a diverse set of channels from SEO, to direct mail marketing, to Google Local Services Ads, and more.
Get a ServiceTitan Demo to See How We Can Help You Optimize and Grow Your Electrical Business
Using a best-in-class electrical software like ServiceTitan gives contractors the tools they need to maintain full visibility into their business, leverage automation, and empower their teams with the tools they need to grow.
In addition to the dashboard and reporting features discussed above, our software offers tools to facilitate the entire electrical business workflow, including:
Want to see how ServiceTitan’s electrical software can give you the tools you need to streamline operations and grow your business? Schedule a call for a free product tour.


Frequently Asked Questions (FAQs)
Q1. What is the difference between gross and net profit margins?
Gross profit margin measures how much revenue remains after subtracting direct job costs, such as labor, materials, subcontractors, permits, and equipment rentals. It shows how profitable individual jobs or service lines are.
On the other hand, net profit margin measures what remains after all business expenses (including overhead, rent, insurance, office salaries, software, marketing, and taxes) have been paid. It reflects the overall financial health and profitability of the business.
Q2. What counts as Cost of Goods Sold for electrical contractors?
For electrical contractors, Cost of Goods Sold (COGS) includes all direct costs required to complete a job, such as:
Electrician wages and payroll taxes
Materials and supplies
Subcontractor costs
Permits and inspection fees
Equipment rentals
Job-specific fuel and travel (when allocated directly)
Disposal or haul-away costs tied to a project
Expenses like office rent, dispatch staff, accounting, insurance, software subscriptions, and marketing are overhead, not COGS.
Q3. How do forum-reported margins compare to audited benchmarks?
In general, residential service contractors frequently report gross margins between 40% and 60%, and net profit figures between 5% to 15%, while commercial contractors cite lower margins on competitive bid work.
By comparison, audited industry benchmarks tend to be more conservative with many reports placing the average electrical contractor's net profit margin in the 4% to 8% range.
Q4. How can electrical contractors increase profit margins?
Electrical contractors can improve profit margins by focusing on the fundamentals that have the biggest financial impact. This means:
Improving job costing accuracy
Increasing technician productivity
Raising prices to reflect value rather than competing solely on price
Reducing callbacks and rework through quality control
Controlling overhead and eliminating unnecessary expenses
Using field service management software to automate scheduling, dispatching, invoicing, and reporting
Q5. How do electrical contractor profit margins compare to other trades?
Electrical contractors generally earn higher profit margins than general contractors, but margins are comparable to those of HVAC and plumbing companies. However, specialized electrical work (such as industrial automation or data center installations) can command premium pricing and stronger margins.
ServiceTitan Electrical Software
ServiceTitan is a comprehensive electrical business software solution built specifically to help service companies streamline their operations, boost revenue, and achieve growth. Our award-winning, cloud-based platform is trusted by more than 100,000+ contractors across the country.


